|
|
|
| FungiFun |
FungiFun assigns functional annotations to fungal genes or proteins. Based on different classification methods like FunCat (Functional Catalogue) (Ruepp et al., 2004; PubMed), GO (Gene Ontology) (Gene Ontology Consortium, 2004; PubMed) and KEGG (Kyoto Encyclopedia of Genes and Genomes) (Kanehisa and Goto, 2000, [PubMed]), FungiFun categorizes genes and proteins for fungal species on different levels and conducts an enrichment analysis (Priebe et al., 2011; PubMed).
In 2014 a new version was developed comprising several new features that provide a better usability and analysis. A procedure for controlling the FDR (False Discovery Rate) is implemented. Several new graphics enable a fast insight in certain aspects of the results. Nevertheless, the results are listed in a tabular format. They can be filtered and customized as well as exported in different wide-spread file formats.
If you use FungiFun2, please cite:
FungiFun2: A Comprehensive Online Resource for Systematic Analysis of Gene Lists from Fungal Species.
Steffen Priebe; Christian Kreisel; Fabian Horn; Reinhard Guthke; Jörg Linde. Bioinformatics 2014.
doi: 10.1093/bioinformatics/btu627
| Input |
Input mask
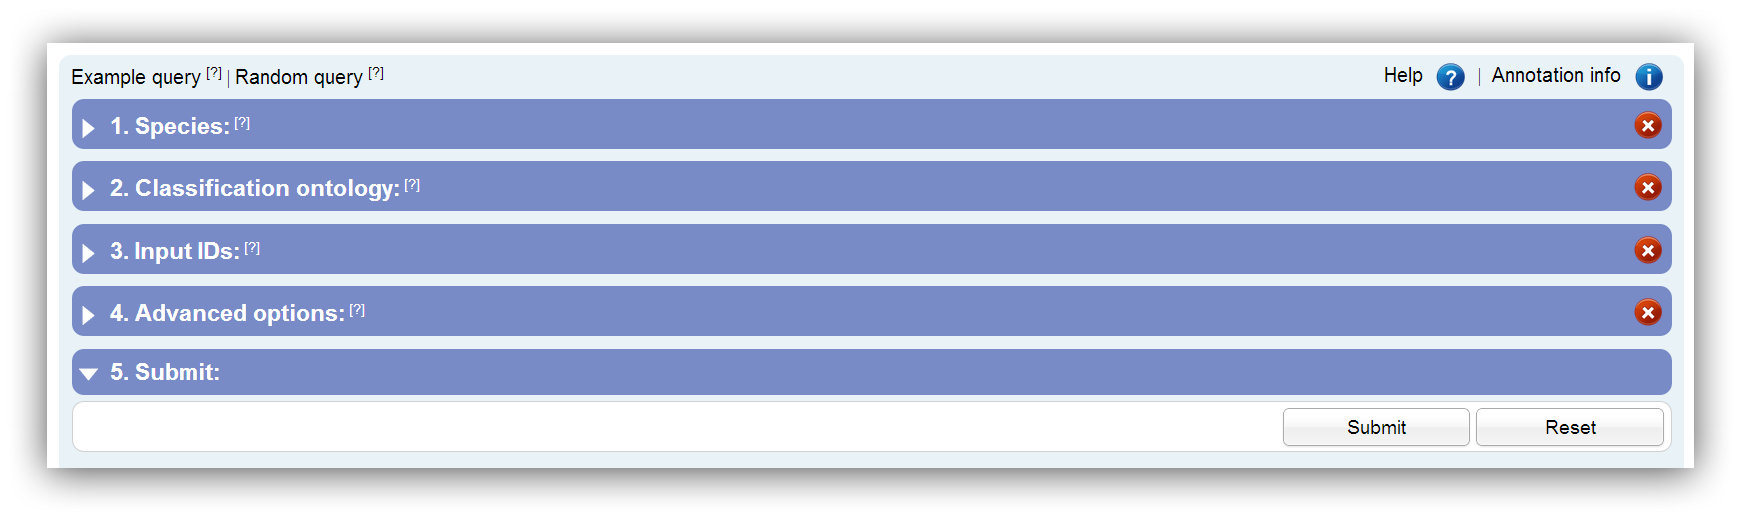
The input mask shows a hierarchical structure and is divided into segments. Every segment has an icon on the right side which indicates whether the preferences are accepted. Only if a green tick is shown on every segment the request should be submitted. The table below shows all possible status icons:

|
The input of this segment is accepted. |

|
Your taken preferences do not pass all restrictions. Please adapt your input. |

|
A required input field is not set. Please check your input. |
Example & random query
An example query can be performed to show the functionalism of FungiFun. Here, preselected DEGs are used for the enrichment analysis. These DEGs were obtained from a study about the heat shock response of Aspergillus fumigatus (Albrecht et al., 2010; PubMed). Additionally, a random query can be performed. This feature selects randomly some gene/protein IDs and requests an enrichment analysis. If no species/strain and classification method is selected they will be chosen randomly, too.
Annotation info
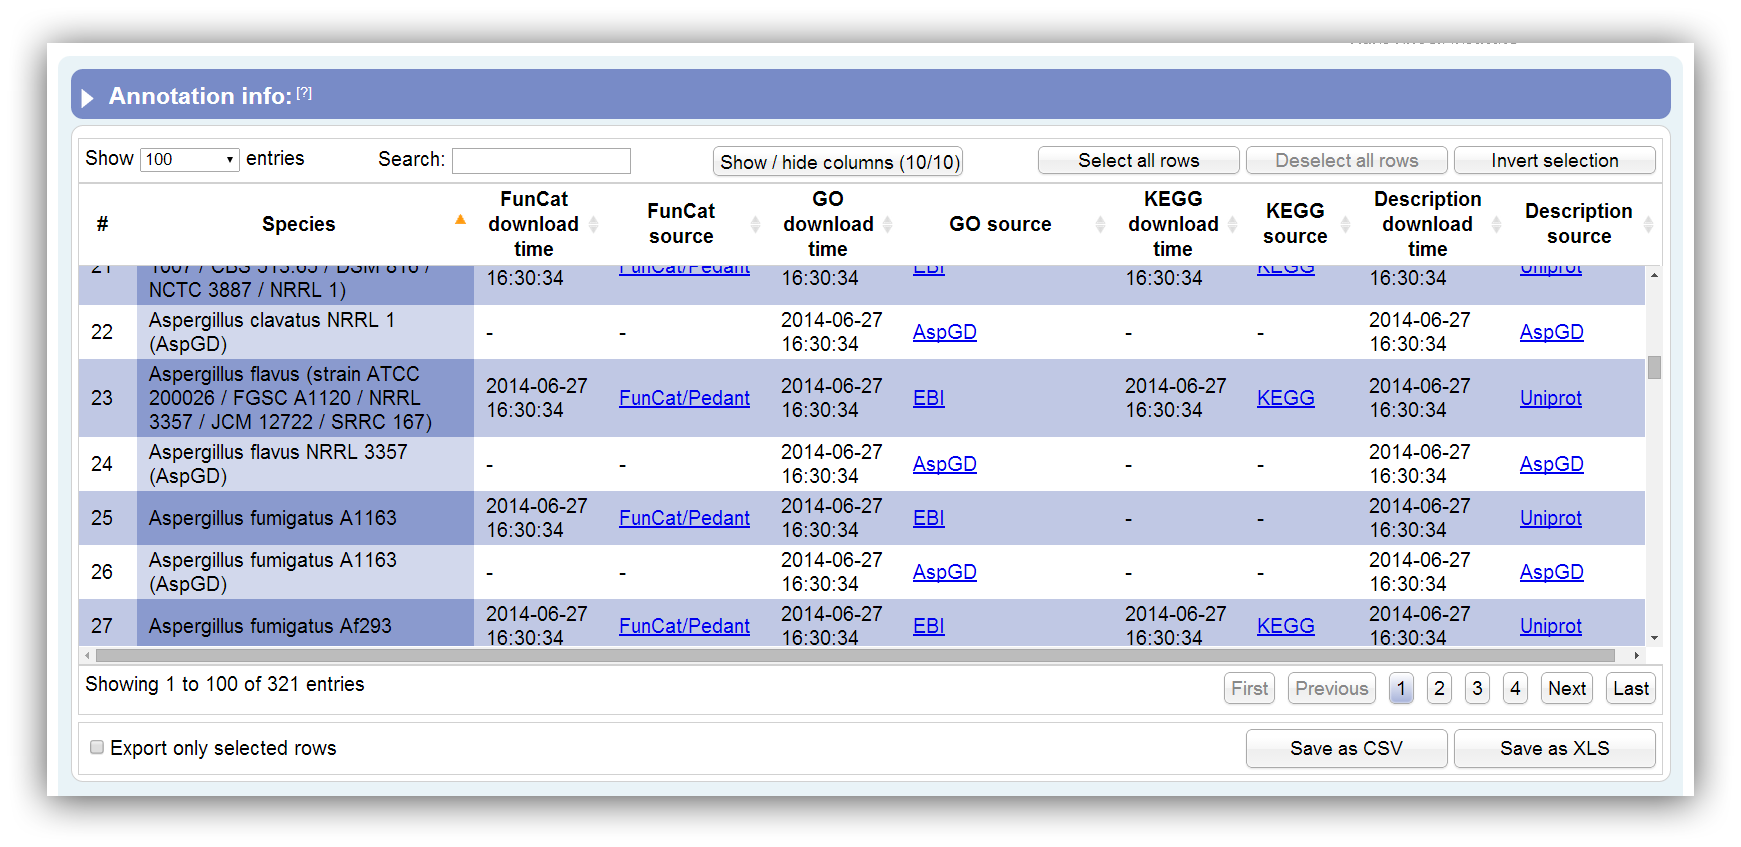
Necessary information about the supported annotations can be displayed using this option. This table summarizes all information about supported species annotations. It can be sorted according each column. By hiding/showing single columns the table can be adjusted in order to present only desired information. You can search keywords using the search field above. Rows are selectable by mouse click, 'Ctrl + click' command, 'Ctrl + Shift + click' command and 'Shift + click' command. The table contains the following columns:
| # | Row number |
|---|---|
| Species | Full description of species/strain |
| FunCat download time | The time where the raw data were downloaded from the source database. |
| FunCat source | Name of the FunCat source database and link to the source file/entry. |
| GO download time | The time where the raw data were downloaded from the source database. |
| GO source | Name of the GO source database and link to the source file/entry. |
| KEGG download time | The time where the raw data were downloaded from the source database. |
| KEGG source | Name of the KEGG source database and link to the source file/entry. |
| Description download time | The time where the raw data were downloaded from the source database. |
| Description source | Name of the description source database and link to the source file/entry. |

|
Change the number of visible rows using the select box above. |
|
|
The search field can be used to filter by keywords. |
|
|
The table can be sorted by multiple columns holding the 'Shift' button and clicking on columns of your choice. |
|
|
Rows are selectable by mouse click, 'Ctrl + click' command, 'Ctrl + Shift + click' command and 'Shift + click' command. |
|
|
Certain rows can be downloaded using the checkbox below. |
The selection of species
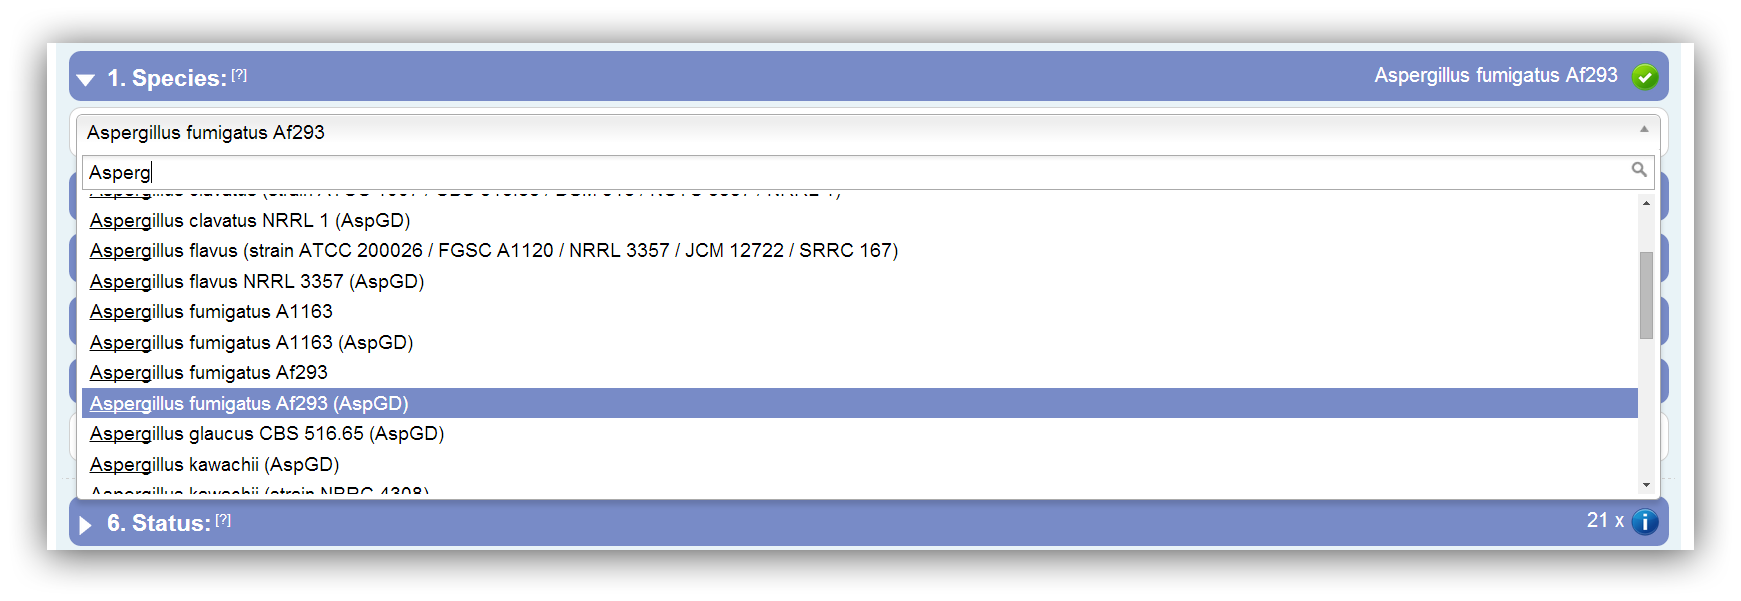
At first you have to select your species/strain of interest. With the help of the depicted drop down box and its included search field a species can be chosen. Due to multiple strains and different annotation sources some species occur more than once. The annotation source is stated in the status field.
|
|
The species of interest have to be selected at first. |
|
|
The search field enables a fast finding and selection of your desired species/strain. |
Selection of classification ontology
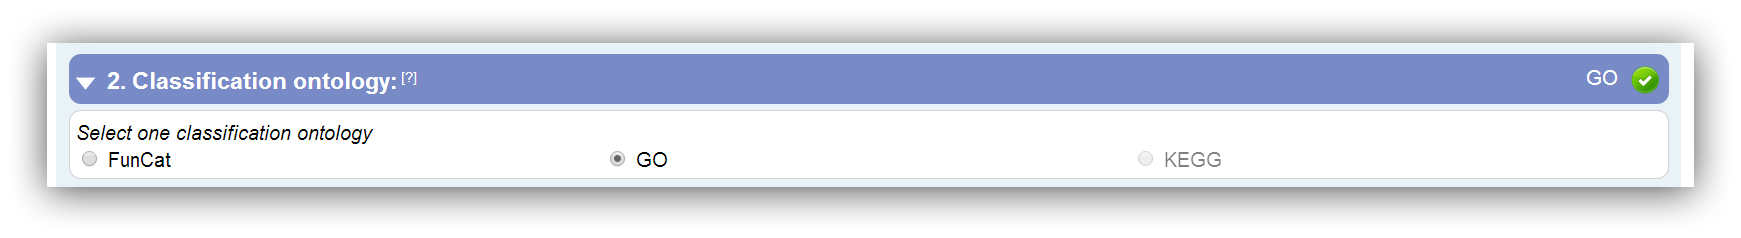
Three classification methods are supported: FunCat, GO and KEGG. Potentially, different types of gene IDs are required for the different classification methods. The potential ID types can be displayed though the special option "Show possible IDs" in the third input segment.
|
|
Only classification ontologies that are supported for the selected species are enabled for selection. |
Entering or uploading of DEGs
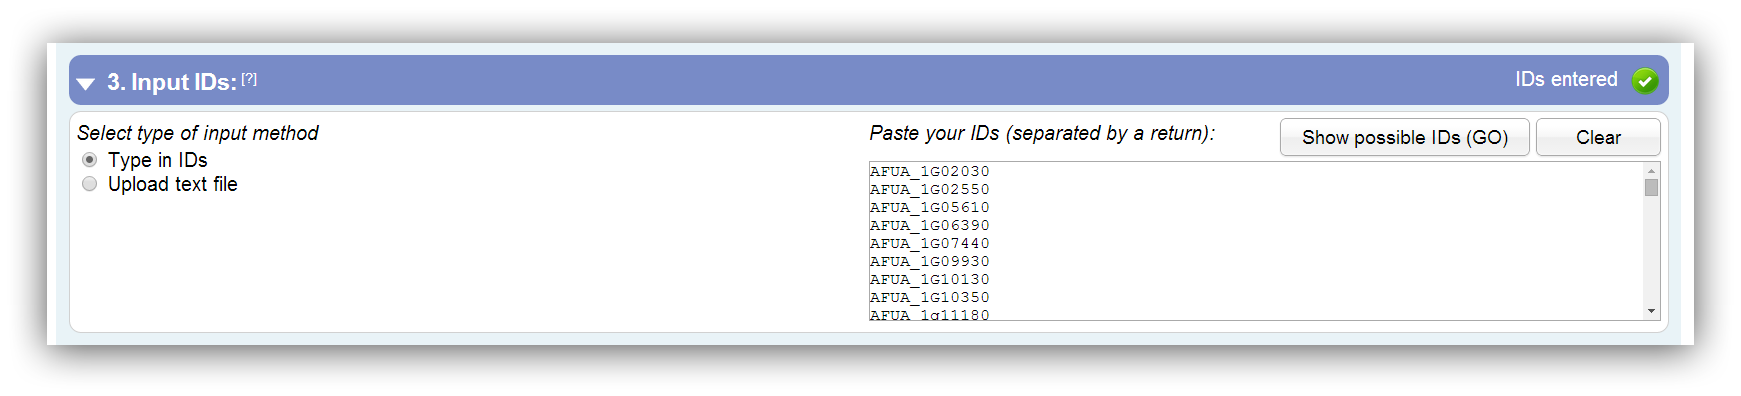
The entered or uploaded gene IDs have to be separated by a return. It is possible to enter gene IDs manually or to upload a flat file. Supported ID types can be viewed by clicking on "Show possible IDs (current method)"
|
|
IDs should be separated by a return. |
|
|
Duplicated IDs are filtered out. |
|
|
Similar IDs are recognized. |
|
|
Ambiguous IDs are recognized. |
|
|
Only flat files smaller than 500,000 Bytes (0.48 MB) are supported for upload. The IDs should be separated by a return. |
Possible input gene IDs
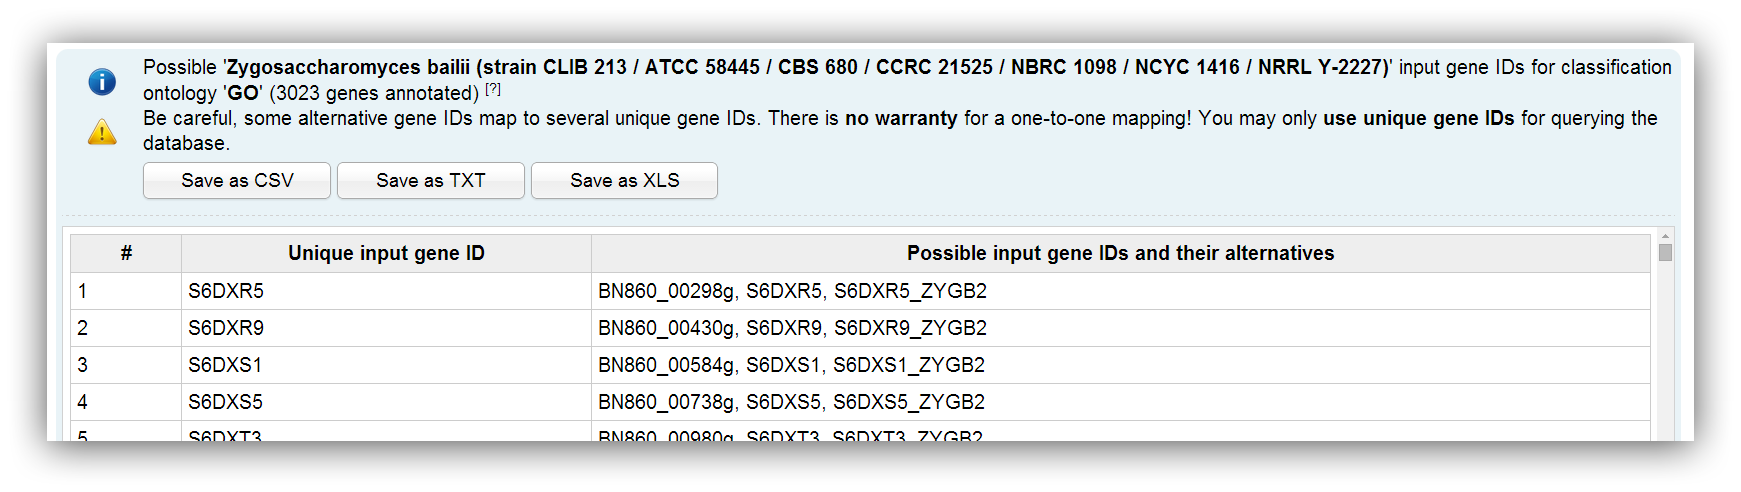
Possible input IDs depend on the selected species and the chosen classification method. Sometimes alternative IDs are provided. You can enter all different ID types and FungiFun recognizes if there are duplicate, similar or ambiguous IDs in the input. Ambiguous IDs map to several genes and you are advised to not use them. Nevertheless, FungiFun displays a warning message if an ambiguous ID was entered.
|
|
It is recommend to use unique gene IDs. |
|
|
You can use the provided files to convert your IDs. |
Advanced options
The following preferences are optional. General options are regarded to every query whereas specific options refine the results of the selected classification method.
General advanced options
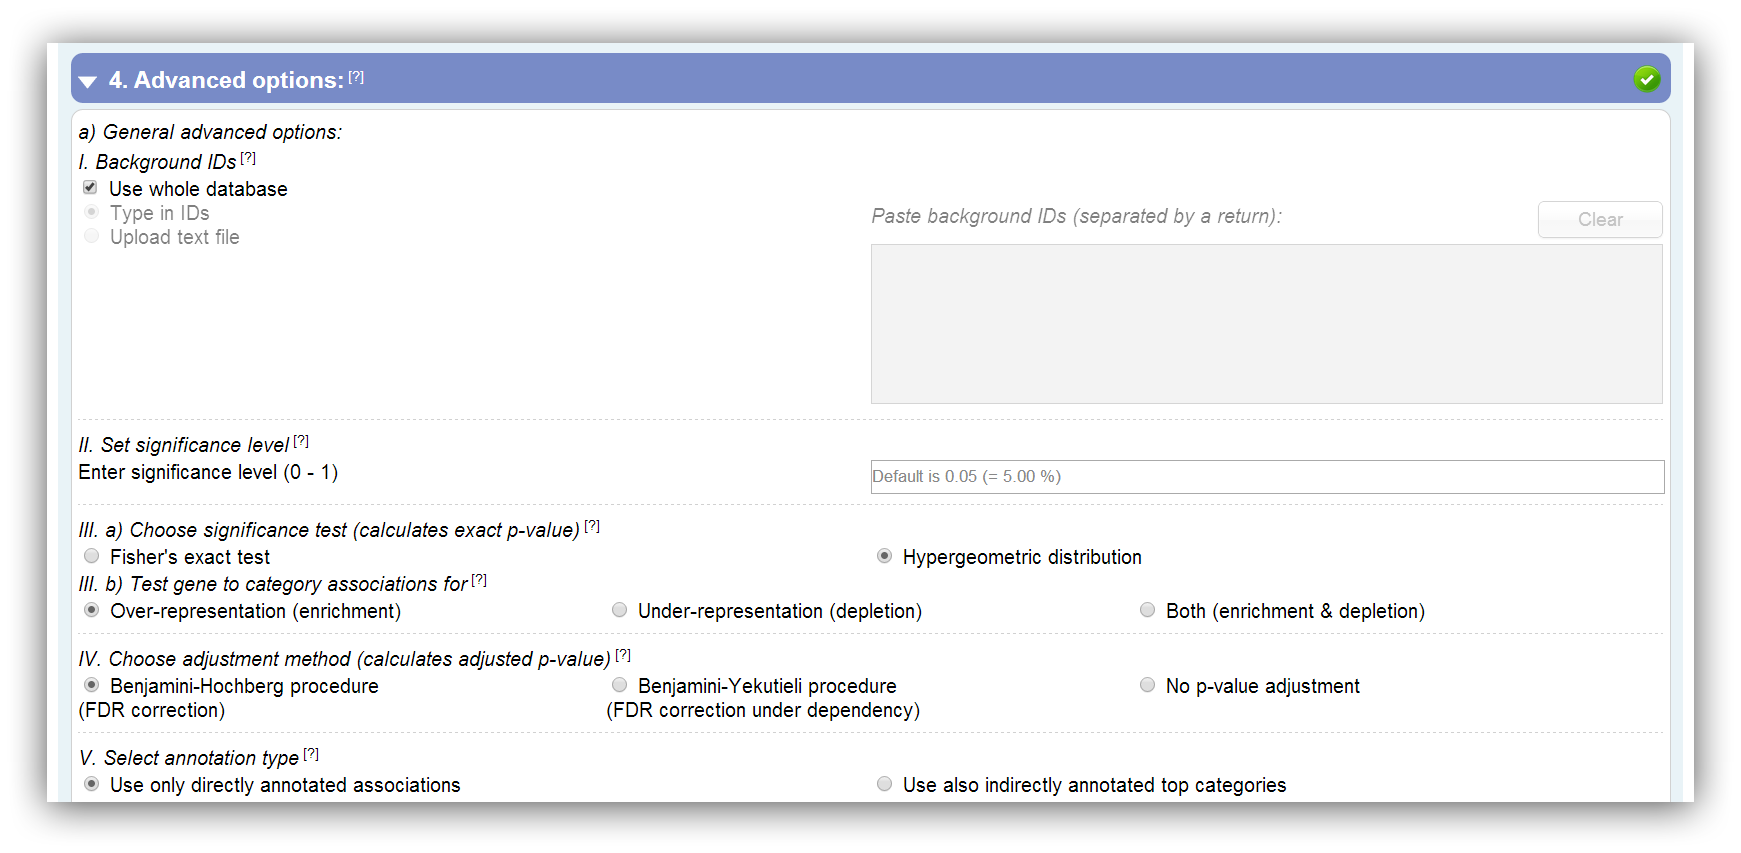
1) A background list of gene IDs can be entered or uploaded. This should be done if your experiment is based on a subset of annotated genes of the selected species.
|
|
IDs should be separated by a return. |
|
|
Duplicated IDs are filtered out. |
|
|
Similar IDs are recognized. |
|
|
Ambiguous IDs are recognized. |
|
|
Only flat files smaller than 500,000 Bytes (0.48 MB) are supported for upload. The IDs should be separated by a return. |
2) Furthermore, the significance level can be set. All results which have a higher p-value than the entered threshold are insignificant and filtered. Default is 0.05 (5 %).
|
|
The default value is 0.05 (5 %). |
|
|
Value have to be in the range of 0 - 1. |
|
|
Only '.' (dot) can be used as separator. |
3a) You can choose one out of two significance tests. On the one side the Hypergeometric distribution and on the other side Fisher's exact test (Fisher, 1922; JSTOR). In the following you can see the 2x2 contingency table which is utilized for the calculation:
| Gene/protein associated with category/pathway | Gene/protein not associated with category/pathway | Total # in rows | |
|---|---|---|---|
| DEG input list (focused gene/protein IDs) | $$ n_{11} $$ | $$ n_{12} $$ | $$ n_{1+} $$ |
| Non-DEG input list (non input gene/protein IDs) | $$ n_{21} $$ | $$ n_{22} $$ | $$ n_{2+} $$ |
| Total # in columns | $$ n_{+1} $$ | $$ n_{+2} $$ | $$ n $$ |
Four values are needed to calculate the whole table:
| $$ n_{11} $$ | The number of DEGs, which belong to a certain category/pathway. |
| $$ n_{1+} $$ | The number of your uploaded and annotated DEGs. |
| $$ n_{+1} $$ | The number of annotated genes, which belong to the certain category/pathway. |
| $$ n $$ | The number of all annotated genes or proteins of the certain species/strain. |
3b) With the mentioned significance tests, the gene to category associations can be tested for over-representation (enrichment), under-representation (depletion) or both (enrichment & depletion) (only Fisher's exact test). In the following the used R functions are listed:
$$ \text{contingencyTable <- matrix(c(}n_{11}\text{, }n_{12}\text{, }n_{21}\text{, }n_{22}\text{, nrow=2, ncol=2, byrow = TRUE)} $$| Hypergeometric distribution | Fisher's exact test | |
|---|---|---|
| Over-representation (enrichment) | $$ \text{phyper(}n_{11}\text{ - 1, }n_{+1}\text{, }n_{+2}\text{, }n_{1+}\text{, lower.tail = FALSE)} $$ | $$ \text{fisher.test(contingencyTable, alternative = "greater")} $$ |
| Under-representation (depletion) | $$ \text{phyper(}n_{11}\text{, }n_{+1}\text{, }n_{+2}\text{, }n_{1+}\text{, lower.tail = TRUE)} $$ | $$ \text{fisher.test(contingencyTable, alternative = "less")} $$ |
| Both (enrichment & depletion) | $$ \text{-} $$ | $$ \text{fisher.test(contingencyTable, alternative = "two.sided")} $$ |
4) As a consequence of multiple hypothesis testing, the probability for false discoveries increases. To deal with this problem the Benjamini-Hochberg procedure (Benjamini and Hochberg, 1995; JSTOR) or the Benjamini-Yekutieli procedure (Benjamini and Yekutieli, 2001; JSTOR) can be utilized to control the FDR. Nevertheless, it is also possible to turn off the p-value adjustment.
5) You can choose whether you want to use only the directly annotated gene to category associations or whether you will allow also indirectly associations (parent category/pathway associations). These additional associations can be determined by the fact that all three classification ontologies consists out of a hierarchical structure. For example, if a gene X is associated with a category/pathway 333, which belongs to the top categories/pathways 33 and 3, the gene X is also associated with category/pathway 33 and 3. Since some annotation databases do not regard this fact, you can choose the provided option.
FunCat specific options
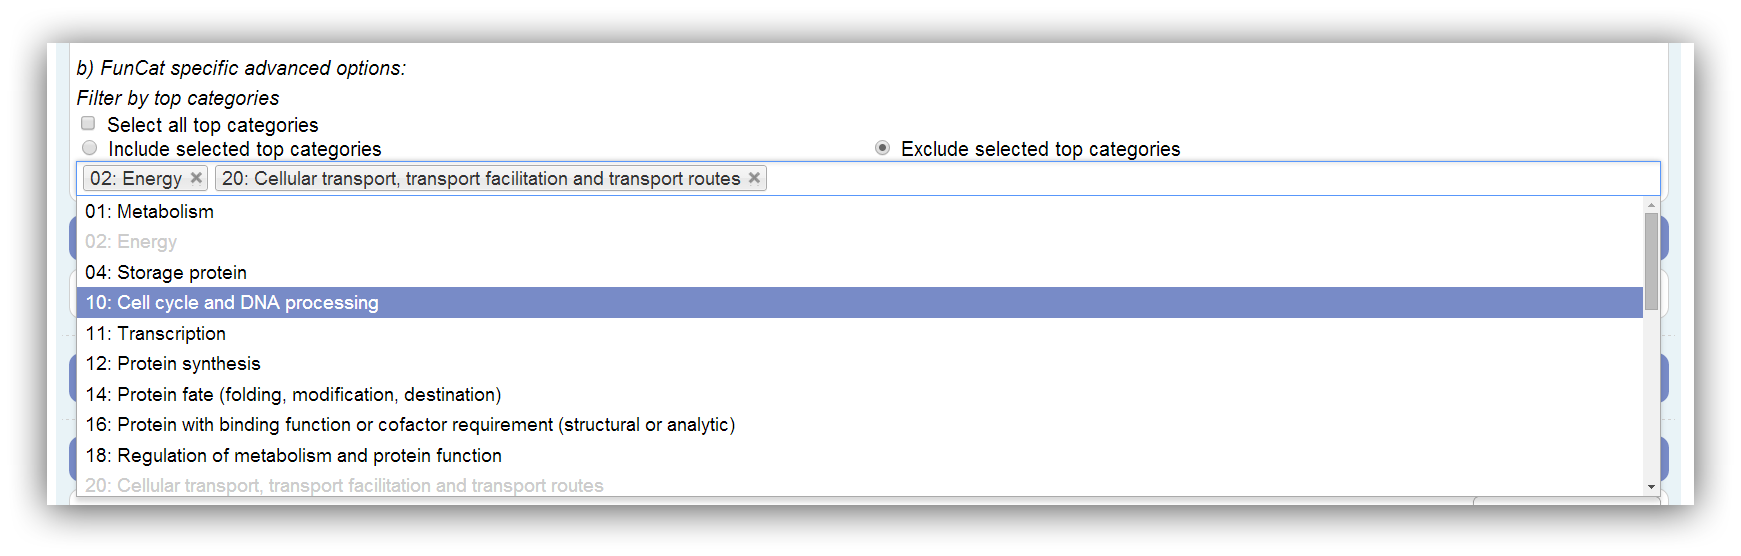
If FunCat is selected as classification ontology the results can be restricted by the selection of certain top categories. The FunCat comprises 27 top categories. Only top categories with associated genes can be selected. This depends on the annotation. If a top category is not associated with any genes of the annotation, it is disabled. Assigned genes are marked as filtered if their top category is omitted. All possible (associated with genes) top categories are used by default. At least one has to be selected.
|
|
All possible (associated with genes) top categories are used by default. |
|
|
Disabled (grey) top categories are not associated with any genes of the annotation. |
|
|
Genes which are only assigned to omitted categories are marked as filtered in the results. |
|
|
At least one category has to be chosen. |
GO specific options
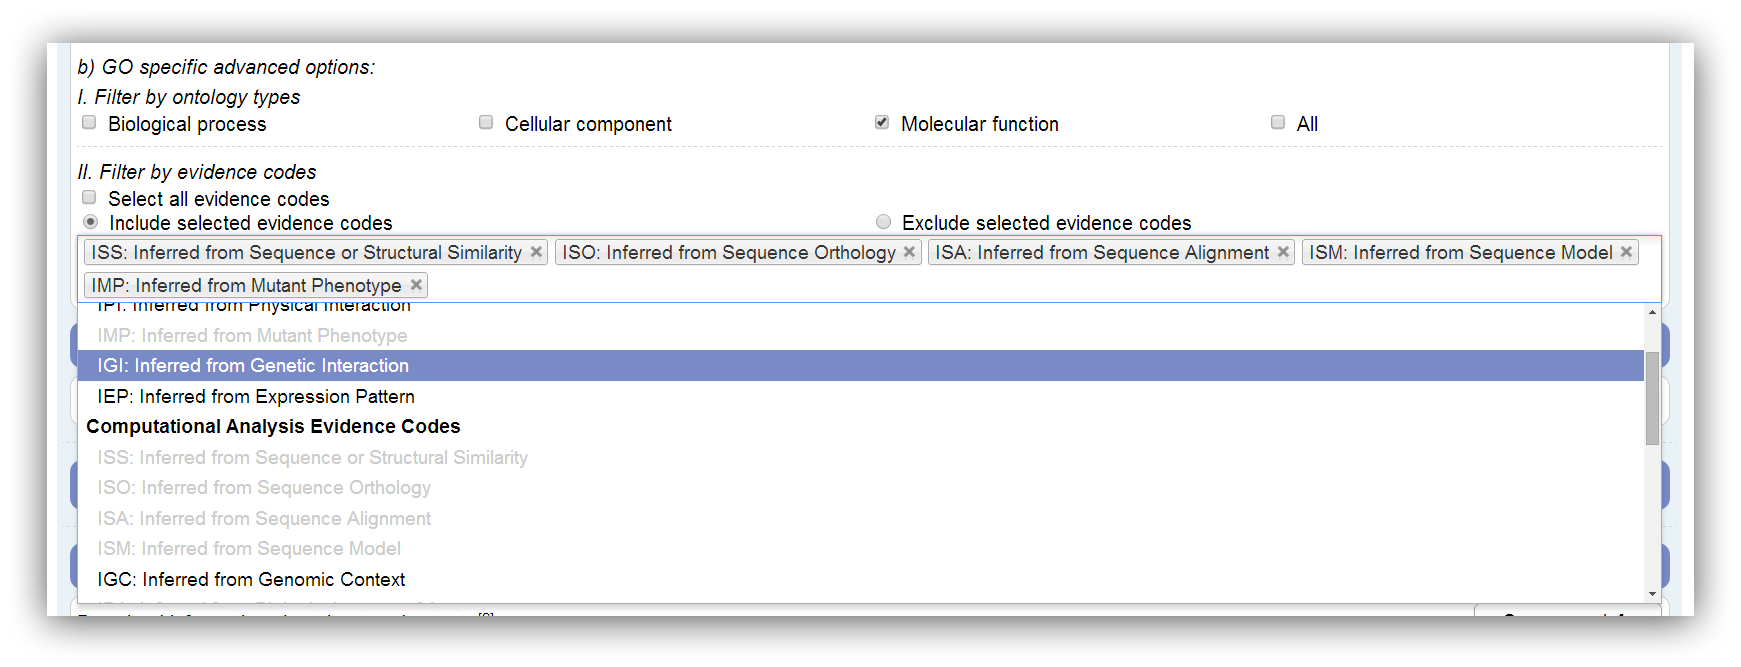
The GO is divided into 3 ontologies named Biological Process (BP), Cellular Component (CC) and Molecular Function (MF). If a GO annotation enrichment analysis is performed, the results can be restricted by these ontologies. Genes which are only assigned to omitted ontologies are marked as filtered in the results. All ontologies are used by default. At least one ontology has to be selected.
|
|
Genes which are only assigned to omitted ontologies are marked as filtered in the results. |
|
|
At least one ontology has to be chosen. |
Furthermore, GO annotation can be restricted by evidence codes. These codes encode the analysis or experiment which supports the annotation. Disabled evidence codes are not represented in the annotation. Assigned genes are marked as filtered if their evidence code is omitted. All possible evidence codes are used by default. At least one has to be selected.
|
|
All possible evidence codes are used by default. |
|
|
Disabled (grey) evidence codes are not represented in the annotation. |
|
|
Genes with omitted evidence codes are marked as filtered in the results. |
|
|
At least one evidence code has to be chosen. |
KEGG specific options
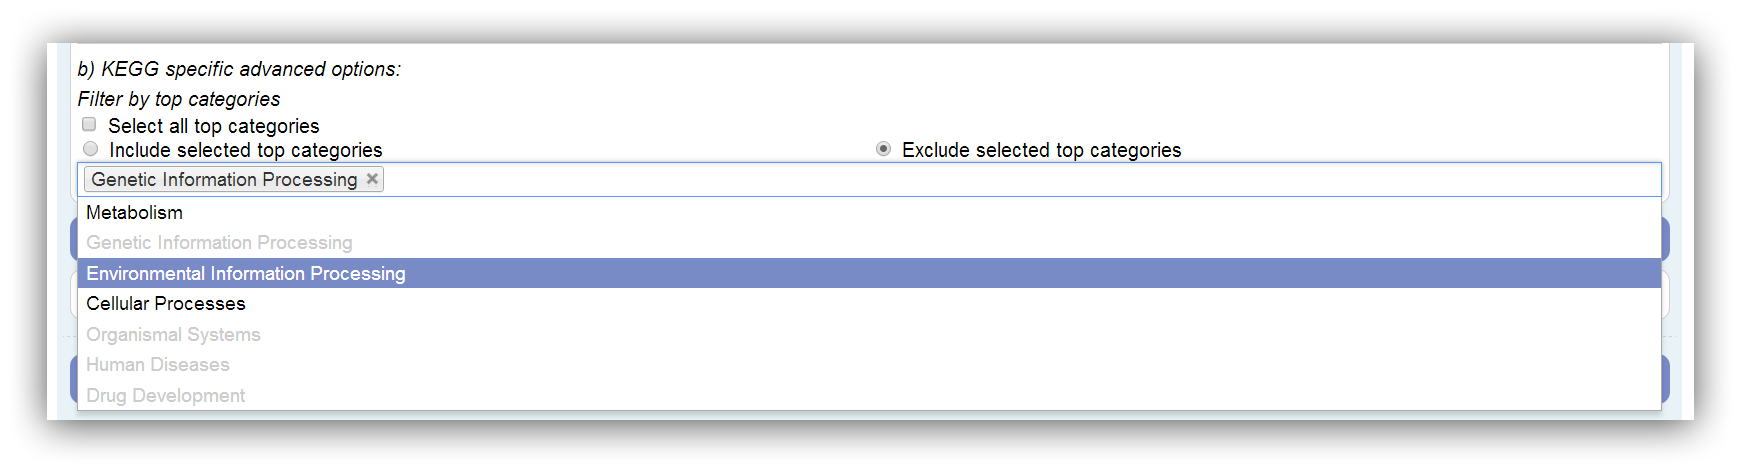
The KEGG is divided into 7 top categories: Metabolism, Genetic Information Processing, Environmental Information Processing, Cellular Processes, Organismal Systems, Human Diseases and Drug Development. Only top categories with associated genes can be selected. This depends on the annotation. If a top category is not associated with any genes of the annotation, it is disabled. Assigned genes are marked as filtered if their top category is omitted. All possible (associated with genes) top categories are used by default. At least one has to be selected.
|
|
All possible (associated with genes) top categories are used by default. |
|
|
Disabled (grey) top categories are not associated with any genes of the annotation. |
|
|
Genes which are only assigned to omitted categories are marked as filtered in the results. |
|
|
At least one category has to be chosen. |
| Output |
Export of query information
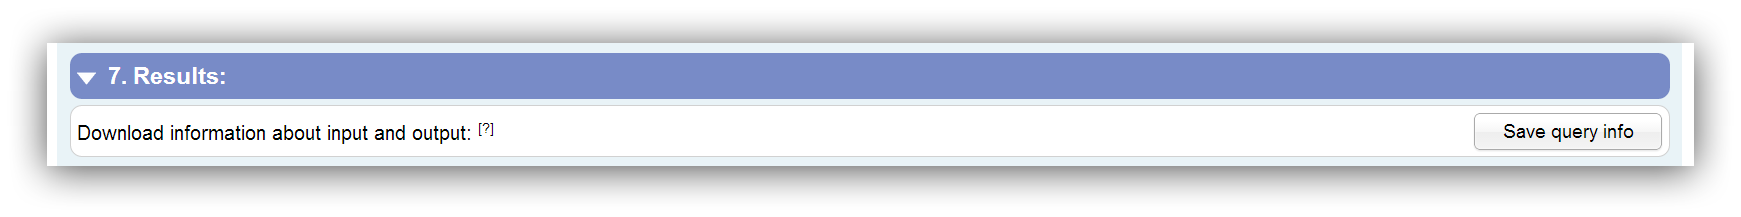
Information about input genes, selected options and output categories can be downloaded as flat file using the "Save query info" button.
Distribution of categories and genes
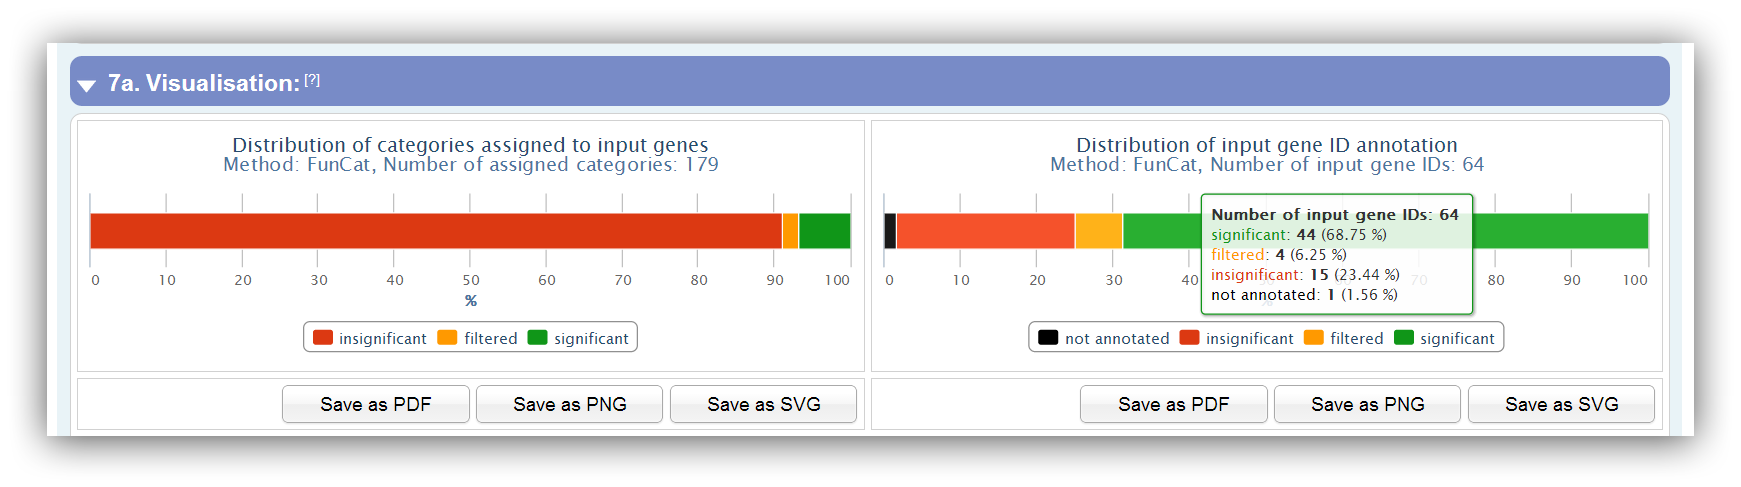
Two charts provide an overview of assigned categories and input genes, which can be either be "insignificant", "filtered" or "significant". In addition, gene IDs can be "not annotated" if they do not match with any ID of the database.
|
|
Only significant categories/genes which do not pass the restrictions are filtered. |
|
|
Is the significance level 1 (100 %) no insignificant categories/genes exist. |
|
|
By clicking on items in the legend this group will be enabled/disabled in the plot. |
|
|
Additional information are available by mouse over the plots. |
Pie chart, column chart and graph
Pie chart: Gene IDs for assigned categories
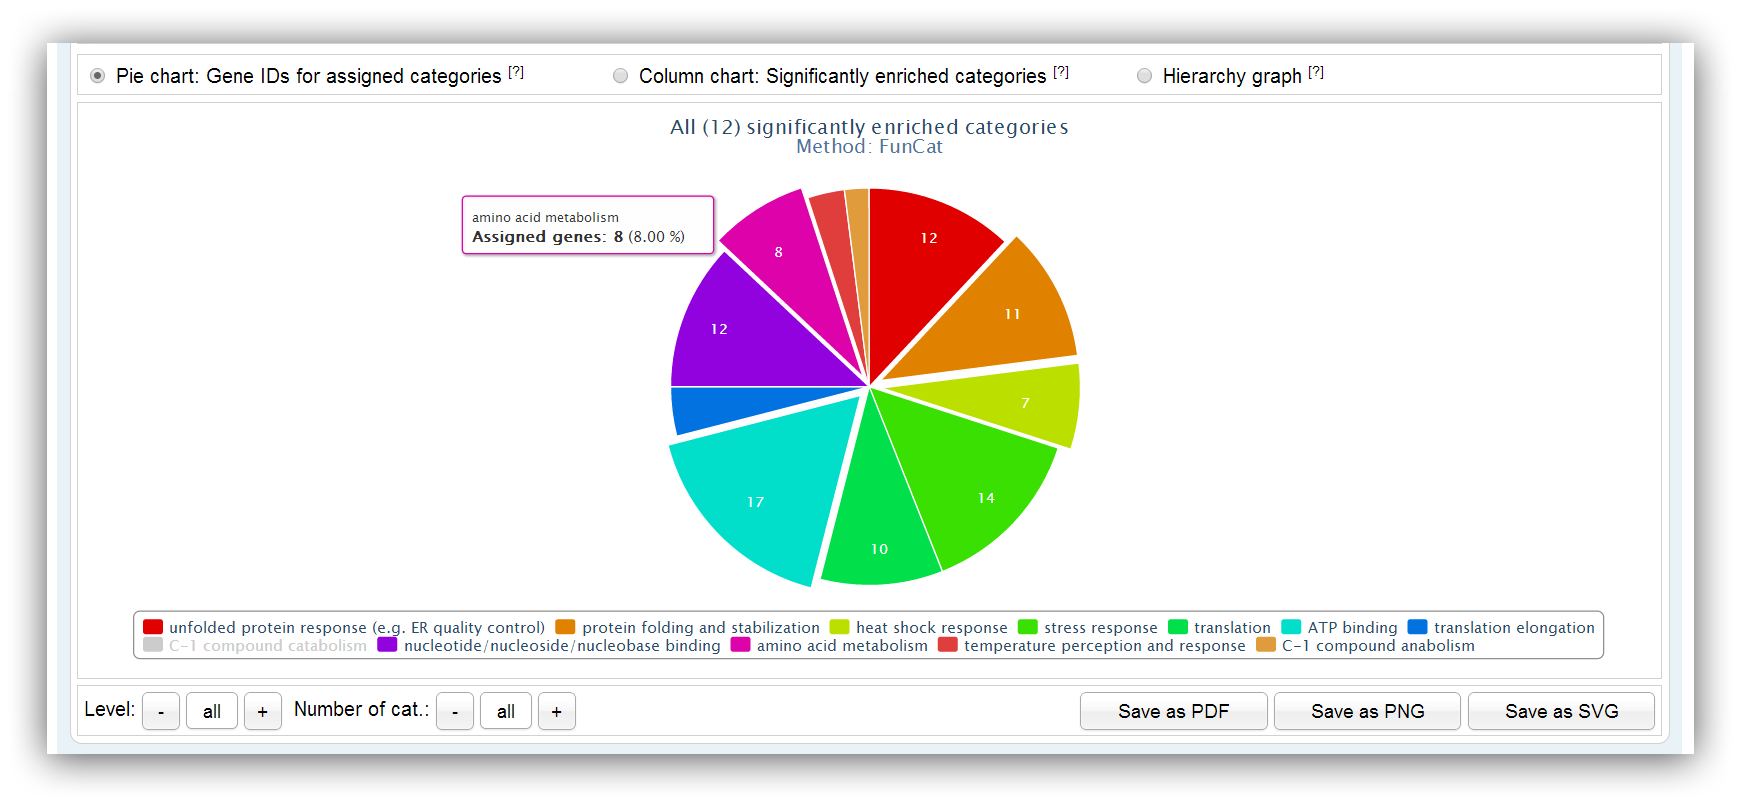
The pie chart depicts the number of assigned genes for each significantly enriched category/pathway. Different hierarchy levels can be selected for FunCat and KEGG queries. Not more than 20 categories/pathways are shown by default. Their number can be adjusted using the buttons below.
|
|
Slices can be highlighted holding the 'Ctrl' button and clicking on slices of your choice. |
|
|
You can click on the items of the legend to enable/disable some category/pathway. |
|
|
Additional information are shown if you place the mouse courser over certain category/pathway. |
|
|
Different hierarchy levels can be selected using the buttons below. (only for FunCat and KEGG queries) |
|
|
The number of shown categories/pathways can be adjusted using the buttons below. |
Column chart: Information about enriched categories
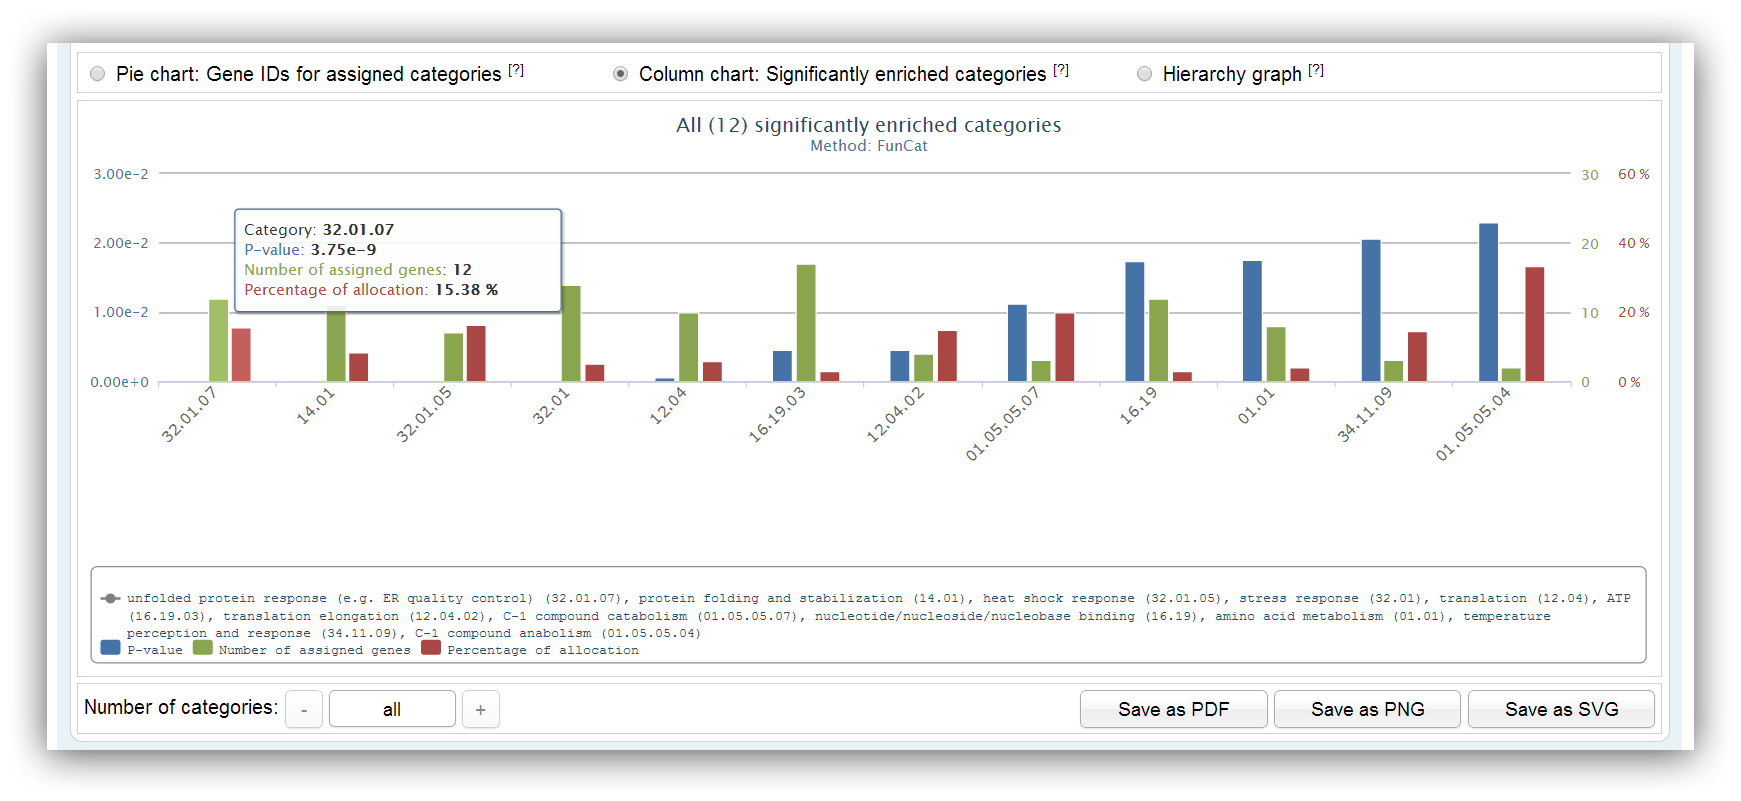
This chart shows information about significantly enriched categories/pathways. It summarizes the number of assigned genes, the p-value and the percentage of allocation for each category/pathway. The maximum number of categories/pathways is 20. Other categories/pathways can be shown using the buttons below.
|
|
You can click on the items of the legend to enable/disable some axis. |
|
|
Additional information are shown if you place the mouse courser over certain category/pathway. |
|
|
The categories/pathways are sorted by the chosen p-value type. (either exact or adjusted p-value) |
|
|
Other categories/pathways can be shown using the buttons below. |
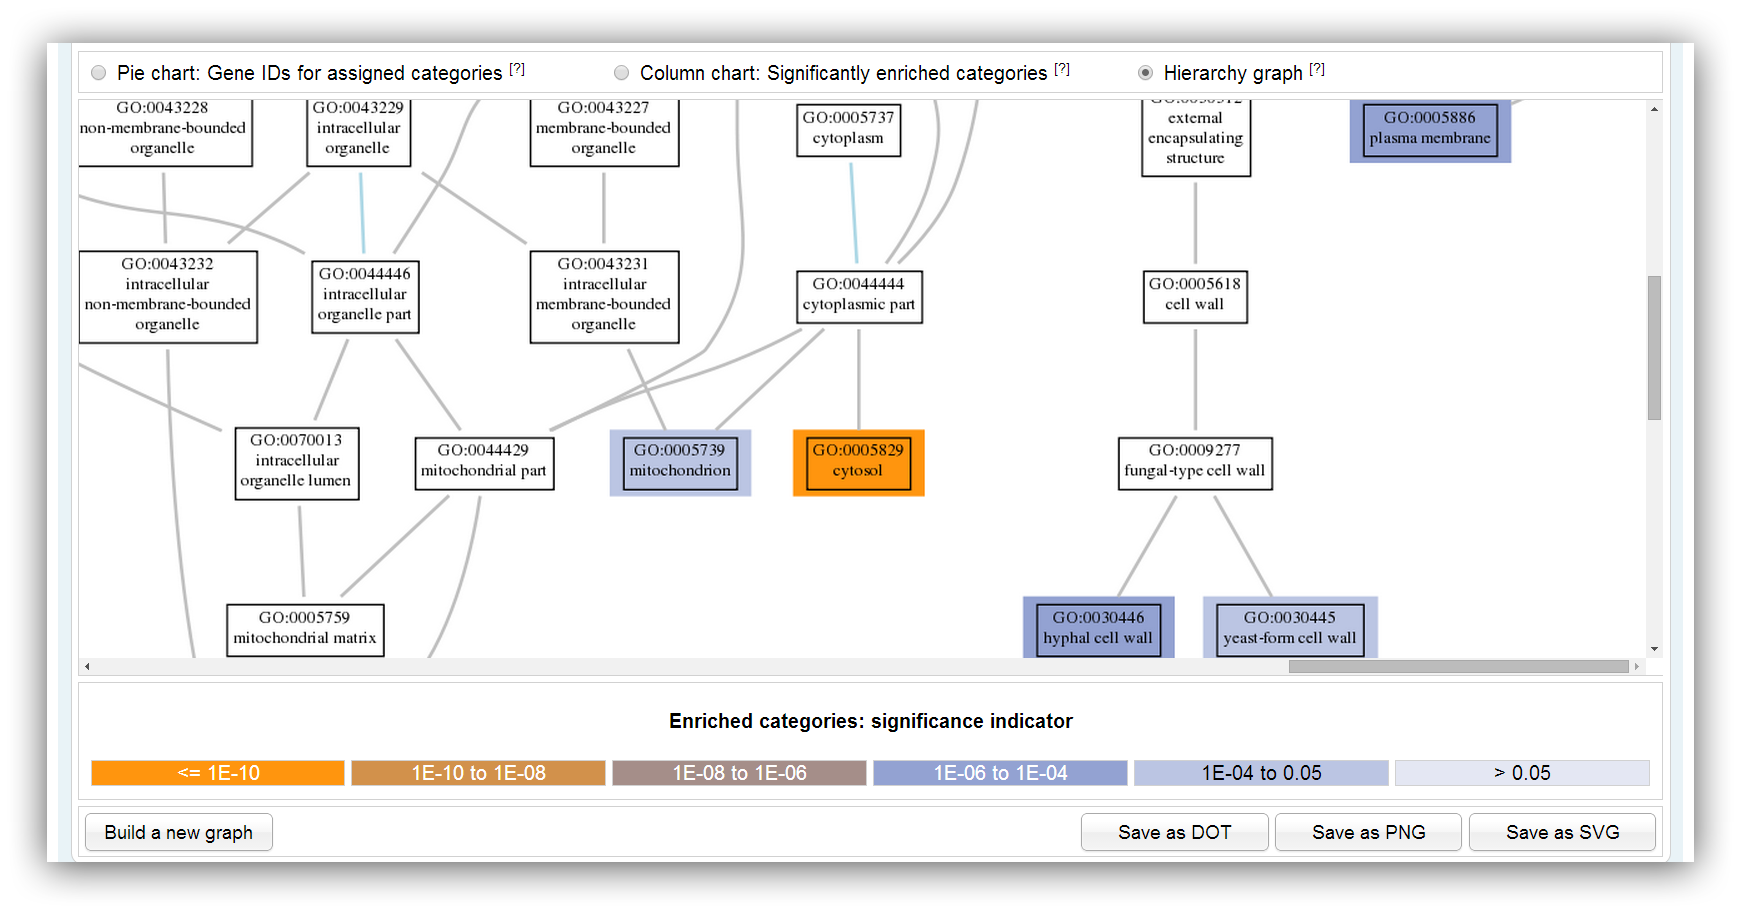
Graph: Visualisation for FunCat or KEGG classification
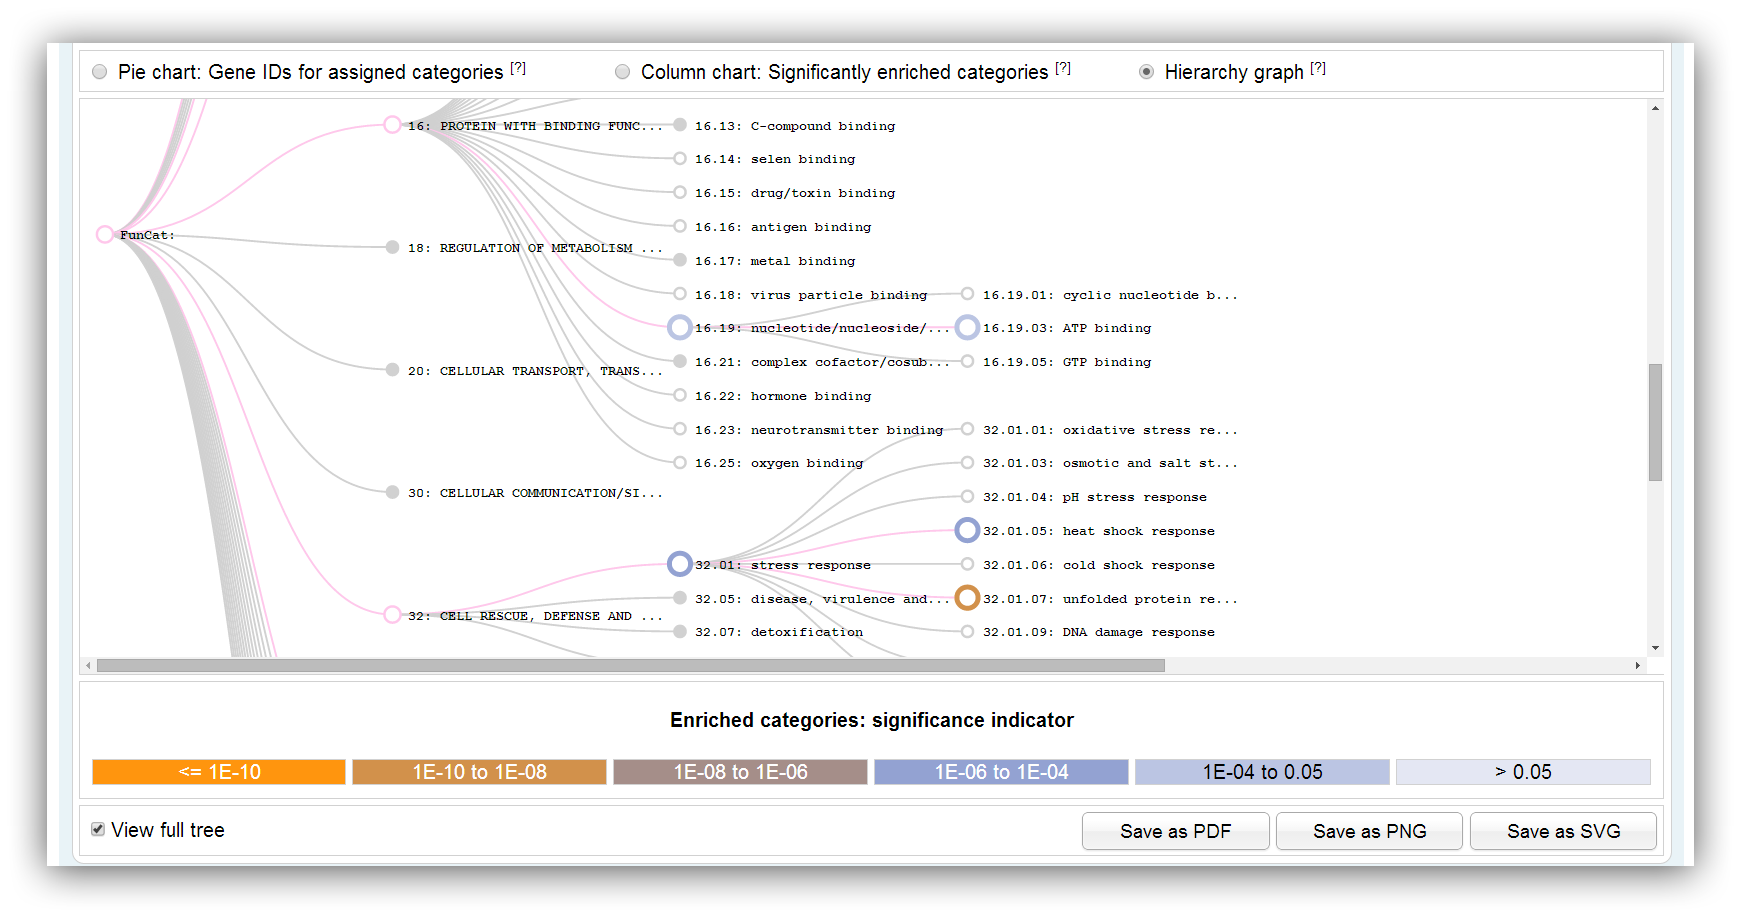
The graph shows the hierarchically structure of FunCat or KEGG. Significantly enriched categories/pathways are highlighted in different colours. Only a subgraph with significantly overrespresented categories/pathways is shown by default. The colours indicate the range of significance. You can show the full graph clicking on the check box below. Filled circles indicate that the vertex has a collapsed subgraph.
|
|
Subgraphs can be collapsed/expanded clicking on filled vertices. (filled circles indicate if the vertex has a collapsed subgraph) |
|
|
The full graph can be shown clicking on the checkbox below. |
Graph: Visualisation for GO classification
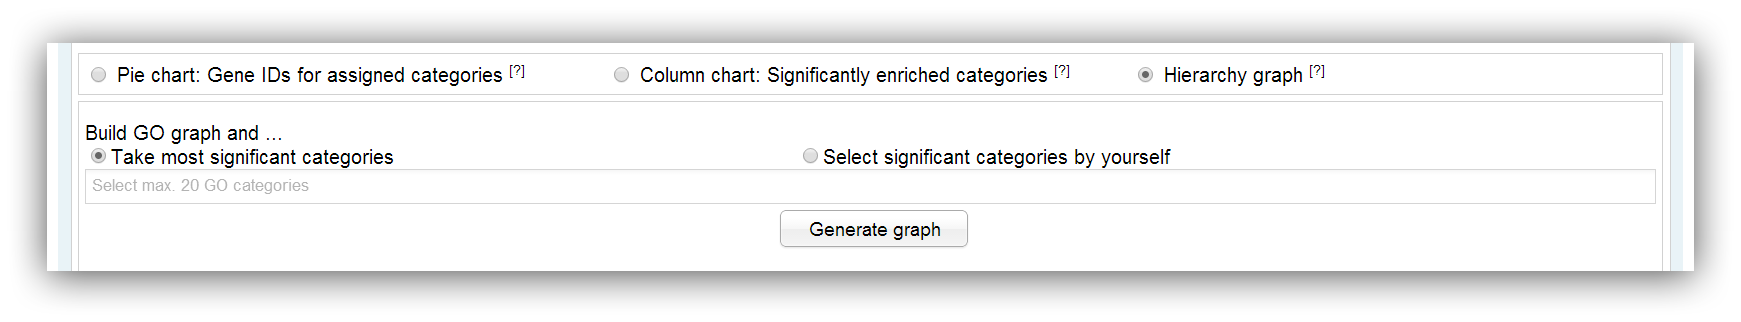
The generation of a GO graph can be commissioned using this input mask. The graph is built with the help of the AmiGO web-service (Carbon et al., 2009; PubMed). A maximum number of 20 significantly enriched categories can be used for generation. This limitation is owed to the fact that the resulting graph would be too confusing and the generation takes a too long time. You can build the graph with the 20 most significant categories or you select certain categories on your own.
The graph shows a subgraph of the GO hierarchy. The chosen significantly enriched categories are highlighted in different colours. The colours indicate the range of the p-value.
Summary tables
Summary table for significantly enriched categories
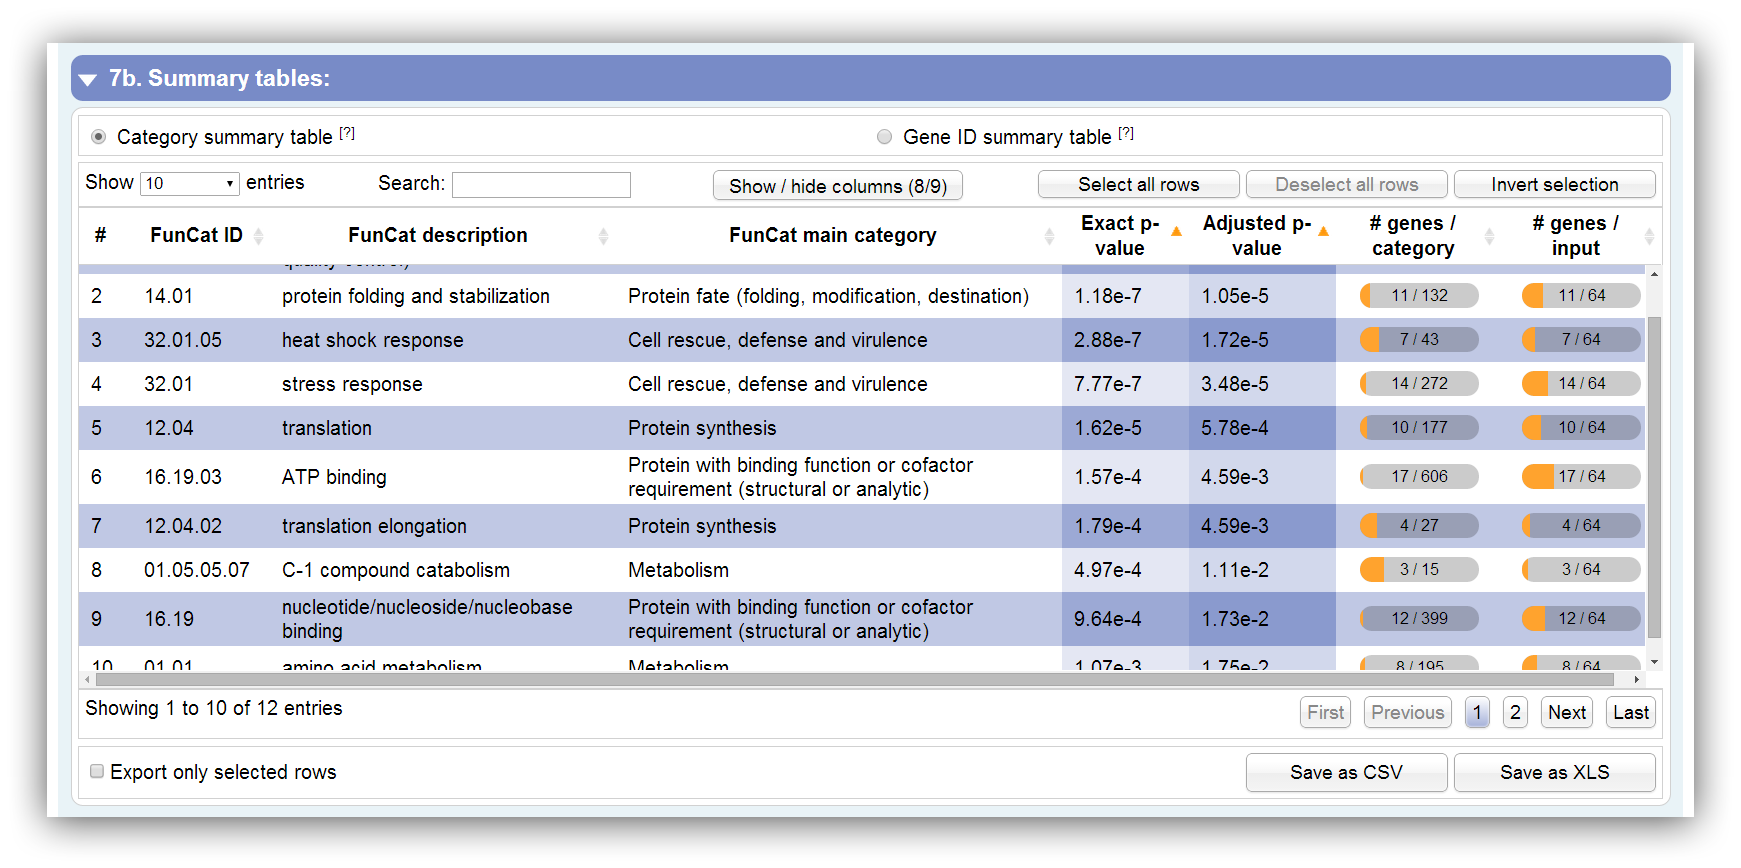
This table summarizes all information about significantly enriched categories. It can be sorted according each column. By hiding/showing single columns the table can be adjusted in order to present only desired information. You can search keywords using the search field above. Rows are selectable by mouse click, 'Ctrl + click' command, 'Ctrl + Shift + click' command and 'Shift + click' command. The table contains the following columns:
| # | Row number |
|---|---|
| FunCat ID | GO ID | KEGG pathway ID | ID of FunCat category, GO term or KEGG pathway |
| FunCat description | GO name | KEGG pathway name | Description of FunCat category, GO term or KEGG pathway |
| FunCat main category | GO namespace | KEGG main category | Description of FunCat, GO or KEGG top category |
| Gene ID(s) | Assigned Gene ID(s). They are listed in brackets if some IDs are similar. This column is not visible by default. |
| Exact p-value | Exact p-value which is calculated by Fisher's exact test or Hypergeometric distribution. Initially, the table is sorted by this column. |
| Adjusted p-value | Adjusted p-value which is calculated by Benjamini-Hochberg procedure or Benjamini-Yekutieli procedure. Initially, the table is sorted by this column. |
| # genes / category | Number of assigned genes to this category. |
| # genes / input | Number of assigned genes out of the entered gene IDs. |
|
|
Change the number of visible rows using the select box above. |
|
|
The search field can be used to filter by keywords. |
|
|
The table can be sorted by multiple columns holding the 'Shift' button and clicking on columns of your choice. |
|
|
Rows are selectable by mouse click, 'Ctrl + click' command, 'Ctrl + Shift + click' command and 'Shift + click' command. |
|
|
Certain rows can be downloaded using the checkbox below. |
Summary table for significantly assigned genes
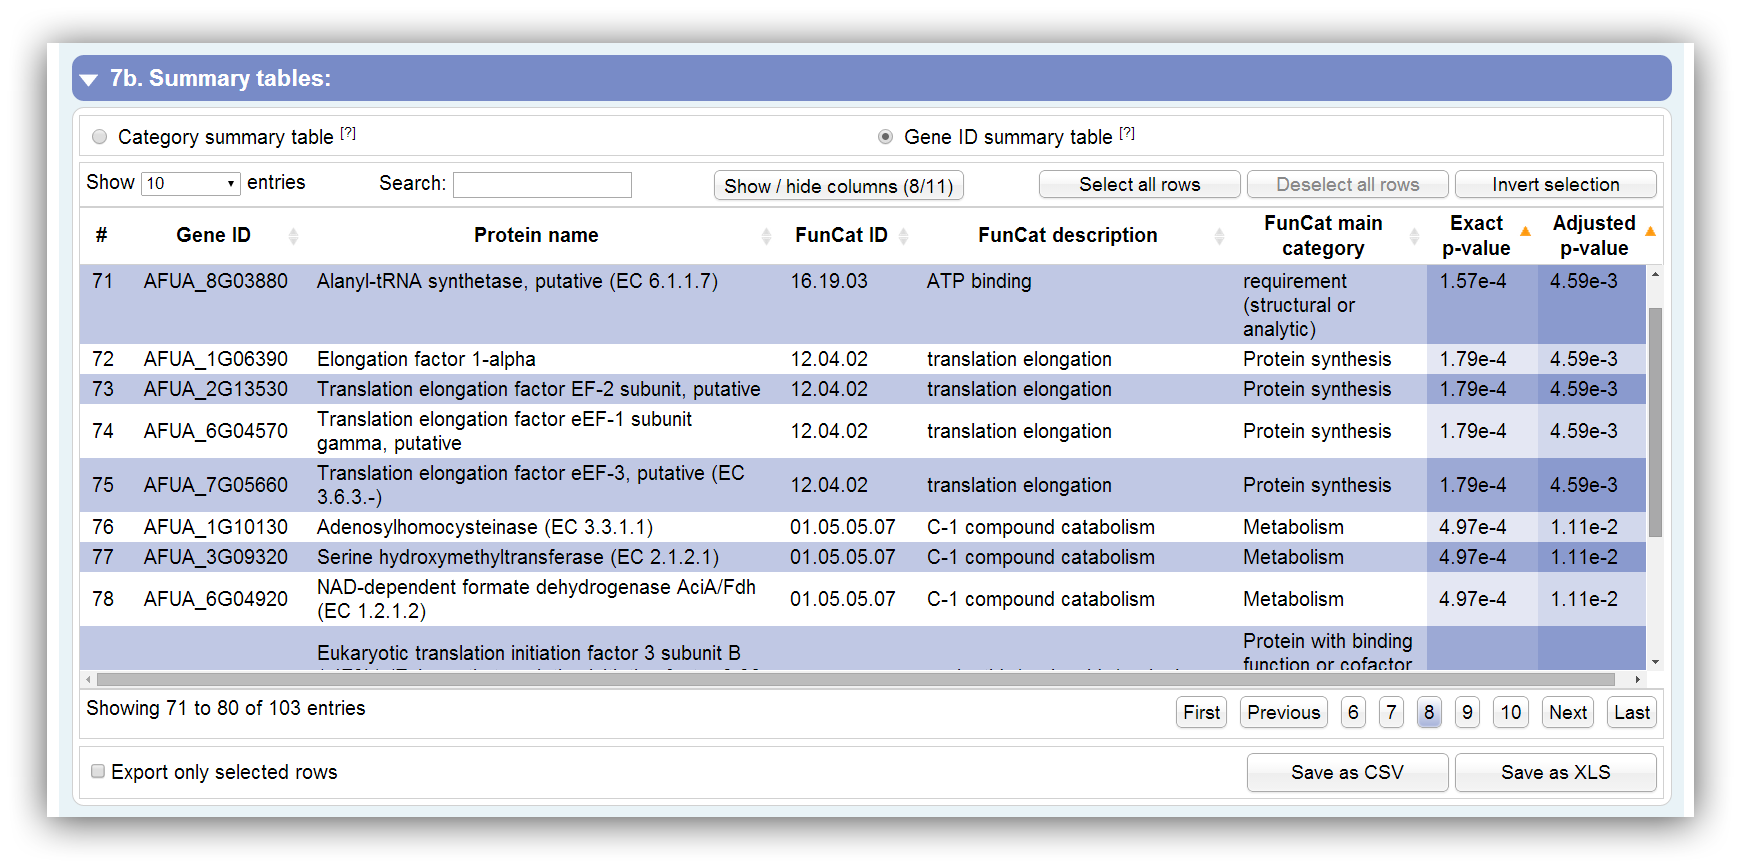
This table summarizes all information about genes which were assigned to significantly enriched categories. It can be sorted according each column. By hiding/showing single columns the table can be adjusted in order to present only desired information. You can search keywords using the search field above. Rows are selectable by mouse click, 'Ctrl + click' command, 'Ctrl + Shift + click' command and 'Shift + click' command. The table contains the following columns:
| # | Row number |
|---|---|
| Gene ID | Assigned Gene ID. They are separated by '|' if some IDs are similar. |
| Unique gene ID | Unique gene ID. This column is not visible by default. |
| Protein name | Description of the gene or protein |
| FunCat ID | GO ID | KEGG pathway ID | ID of FunCat category, GO term or KEGG pathway |
| FunCat description | GO name | KEGG pathway name | Description of FunCat category, GO term or KEGG pathway |
| FunCat main category | GO namespace | KEGG main category | Description of FunCat, GO or KEGG top category |
| Evidence code | This column is only visible in GO requests. The 'Evidence code' for the GO annotation is shown. Get more information here. |
| Exact p-value | Exact p-value which is calculated by Fisher's exact test or Hypergeometric distribution. Initially, the table is sorted by this column. |
| Adjusted p-value | Adjusted p-value which is calculated by Benjamini-Hochberg procedure or Benjamini-Yekutieli procedure. Initially, the table is sorted by this column. |
| # genes / category | Number of assigned genes to this category. This column is not visible by default. |
| # genes / input | Number of assigned genes out of the entered gene IDs. This column is not visible by default. |
|
|
Change the number of visible rows using the select box above. |
|
|
The search field can be used to filter by keywords. |
|
|
The table can be sorted by multiple columns holding the 'Shift' button and clicking on columns of your choice. |
|
|
Rows are selectable by mouse click, 'Ctrl + click' command, 'Ctrl + Shift + click' command and 'Shift + click' command. |
|
|
Certain rows can be downloaded using the checkbox below. |
| Status box and messages |
The status box
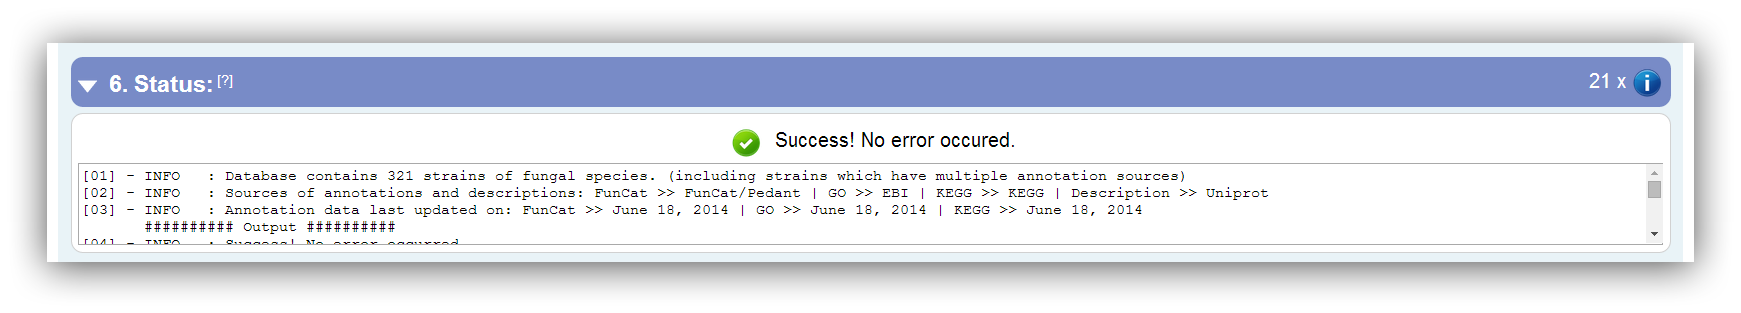
The status box lists detailed information about input and output. It can be used in case of an exception. The icons in the section bar indicate different events:
|
|
Only shown if no exception occurs during your query. |
|
|
Informative messages about the database, input and output. |
|
|
Descriptive messages about warnings of input and output. |
|
|
Descriptive messages about errors of input and output. |
A selection of important status messages
| Type | Message | Description |
|---|---|---|
|
|
Database contains ??? species. (including several strains and multiple annotation sources for some species) | The number of available species is depicted. This includes several strains and annotation sources. |
|
|
Success! No error occurred. | The enrichment analysis terminated without any error. |
|
|
Query time '???' | The time when the query was submitted. |
|
|
Query token '???' | A unique token for your query. Used for the export file names. |
|
|
Chosen species '???' | The chosen species of your query. |
|
|
Chosen classification method '???' | The selected classification ontology. Either FunCat, GO or KEGG. |
|
|
[Entered] Significance level '???' ('???' %) | The entered significance level. If nothing was entered the default value (0.05 (5 %)) is shown. |
|
|
Hash for input IDs '???' [(from uploaded '???')] | A token for your input IDs. Used for the export file names. |
|
|
Chosen significance test '???' | Your chosen significance test is shown. At choice are 'Hypergeometric distribution' and 'Fisher's exact test'. |
|
|
Assigned annotation terms were tested for '???' | The assigned annotation terms can either be tested for 'over-representation (enrichment)', 'under-representation (depletion)' or 'both (enrichment & depletion)'. |
|
|
Chosen adjustment method '???' | Your chosen p-value adjustment is shown. At choice are 'Benjamini-Hochberg procedure (FDR correction)' and 'Benjamini-Yekutieli procedure (FDR correction under dependency)'. |
|
|
Only directly annotated associations were used for analysis! | Only directly annotated associations as they were obtained from the source databases were used for analysis. |
|
|
Indirectly annotated top categories were also used for analysis! | Additionally to the directly annotated associations, which were obtained from the source databases, indirectly annotated top category associations were used for analysis, too. |
|
|
Download 'query info' for more detailed information about input and output! | You can download the 'query info' file for more detailed information. |
|
|
[???/???] input gene IDs were found in significantly enriched categories. | Amount of assigned genes which belong to significant categories. |
|
|
[???/???] input gene IDs were found in filtered enriched categories. | Amount of assigned genes which only belong to filtered categories. This message is only shown if their number is not 0. |
|
|
[???/???] input gene IDs were found in insignificantly enriched categories. | Amount of assigned genes which only belong to insignificant categories. This message is only shown if their number is not 0. |
|
|
[???/???] input gene IDs are not annotated. | Amount of non-annotated genes. This message is only shown if their number is not 0. All input gene IDs are marked as not annotated if their ID do not match any ID of the database. |
|
|
[???/???] enriched categories are insignificant. | Amount of insignificant categories in the result. This message is only shown if their number is not 0. |
|
|
[???/???] enriched categories are filtered out. | Amount of filtered categories in the result. This message is only shown if their number is not 0. |
|
|
[???/???] enriched categories matching the criteria. | Amount of significant categories in the results. There may exist other significant categories but they could be filtered. |
|
|
File '???' successfully uploaded! | This message is shown if a file (input IDs, background IDs) was successfully uploaded to the server. |
|
|
File ('???') is ready for upload! | This message is shown if the selected file could be uploaded. |
|
|
GO graph successfully built. | This message is shown if the generation of a GO graph succeeded. |
|
|
Generation of GO graph aborted. | This message is shown if the generation of a GO graph was cancelled. |
|
|
Some input gene IDs are not included in background ID list and therefore marked as 'not annotated'. | If you uploaded a background ID list and some IDs do not match with any of the database this message is shown. |
|
|
Some input gene IDs match several annotated genes! Download 'query info' for more detailed information. | This message is shown if some IDs are not bijective, i.e. they map to several unique gene IDs. These ambiguous IDs are listed in the 'query info' file. |
|
|
Some background gene IDs match several annotated genes! Download 'query info' for more detailed information. | This message is shown if some background IDs are not bijective, i.e. they map to several unique gene IDs. These ambiguous IDs are listed in the 'query info' file. |
|
|
Some data are missing in database! | Some data are missing. This could be e.g. gene/protein descriptions or evidence codes. A placeholder ('NO ENTRY IN DB') is shown in the results table. |
|
|
Duplicated input IDs were found and removed! Download 'query info' for more detailed information. | The input IDs were inspected for duplicates (case insensitive). In case of duplicates found, they were removed and not used for further analysis. |
|
|
Duplicated background input IDs were found and removed! Download 'query info' for more detailed information. | The background IDs were inspected for duplicates (case insensitive). In case of duplicates found, they were removed and not used for further analysis. |
|
|
Some input gene IDs are similar! Download 'query info' for more detailed information. | If some IDs map the same unique ID, they are similar and listed in the 'query info' file. |
|
|
This file type is not supported for upload! Only TXT permitted! | Only flat files (TXT) can be uploaded. All other file types are not supported. |
|
|
This file size ('???' MB) is not supported for upload! Only '???' MB are supported! | To avoid large files to be uploaded, the file size is limited to 500,000 Bytes (0.48 MB). |
|
|
Could not upload chosen file! ('???') | This message is shown if the file properties not pass the restrictions. |
|
|
No gene IDs uploaded! | This message is shown if no gene IDs were entered or uploaded. |
|
|
No background gene IDs uploaded! | This message is shown if no background IDs were entered or uploaded. |
|
|
No input gene ID in background ID list! Query aborted. | If you uploaded a background list with IDs your entered DEGs have to be a subset of these background IDs. If no DEG is in the background list, the query is aborted. |
|
|
Could not query database! [Code: ???] | This error is shown if no connection could be established to the database. (+ internal error code) |
|
|
Entered background gene IDs not found in database! | This error occurs if no background ID matched with annotated IDs. |
|
|
Entered significance level is not numerical! | Only numerical values are allowed. If not, this error is shown. |
|
|
No FunCat main category selected! | You have to select one main category at least or otherwise this error occurs. |
|
|
No matching annotated genes IDs were found in database! | This error is shown if no input gene ID matched any annotated ID. |
|
|
No significant category with ??? (??? %) as significance level found! | This error occurs if all assigned categories do not pass the significance threshold. |
|
|
IDs do not match selected main categories! | If you restricted the results by some main categories and no significantly enriched category matches with your criteria, this message is shown. |
|
|
No GO evidence code selected! | You have to select at least one evidence code or otherwise this error occurs. |
|
|
No ontology type were chosen! | You have to select at least one GO ontology or otherwise this error occurs. |
|
|
IDs do not match selected ontology types! | If you restricted the results by ontologies and no significantly enriched category matches with your criteria, this message is shown. |
|
|
IDs do not match selected evidence codes! | If you restricted the results by some evidence codes and no significantly enriched category matches with your criteria, this message is shown. |
|
|
No KEGG main categories selected! | You have to select one main category at least or otherwise this error occurs. |
|
|
No species chosen! Please select a species. | The analysis could not be started without a selected species. |
|
|
Upload aborted! This file type is not supported for upload! Only TXT permitted! | Only flat files (TXT) can be uploaded. All other file types are not supported. |
|
|
Could not build GO graph! | An internal error occurred. Please contact us including all necessary information about your input. |
| Known issues |
Current bugs and issues are listed in the table below. For reporting a new issue, please send us an eMail.
| ID | Fixed | Date | Program part | Description | Provisional solution |
|---|---|---|---|---|---|
| 001 |
|
2014/03/01 | Output - Table export | Large tables lack in a complete export. The CSV and XLS export files are truncated and have wrong file names. | Deselect some columns or export only certain rows. |
|
|
|
|
|
|
|
|
|
|
|
|
|
|
| Updates |
FungiFun will be updated frequently. New species and strain which are not included in the databases utilized by FungiFun (PEDANT, AspGD, CGD, SGD, EBI, Ensembl Fungi, NCBI, Broad, KEGG) can also be included. The following files are needed in order to include new species:
- Complete species name including strain
- BLAST2GO output file (gene id to GO term association)
- or: FASTA file including protein sequences
- optional: gene description file (gene id to gene name association)